19.4 A11y run logs and reports
For working with the run log and generating a report (Reports and test documentation), accessibility tests have their own tips, tricks and special features.
19.4.1 Working with the run log
After each accessibility test, a log is created that can be used for error analysis.
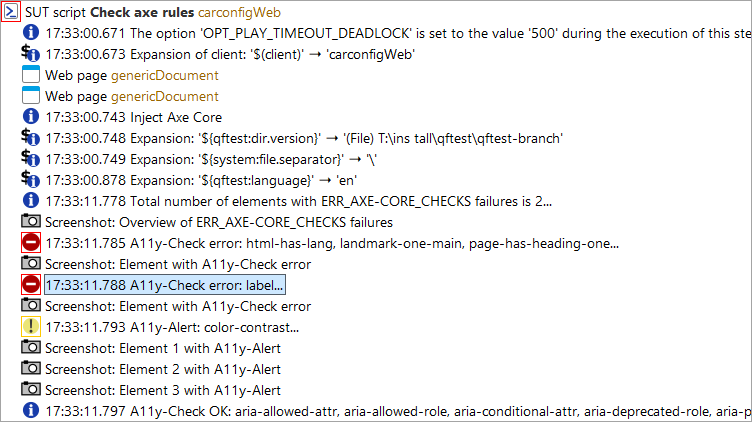
The following image shows the complete error message of the selected error:
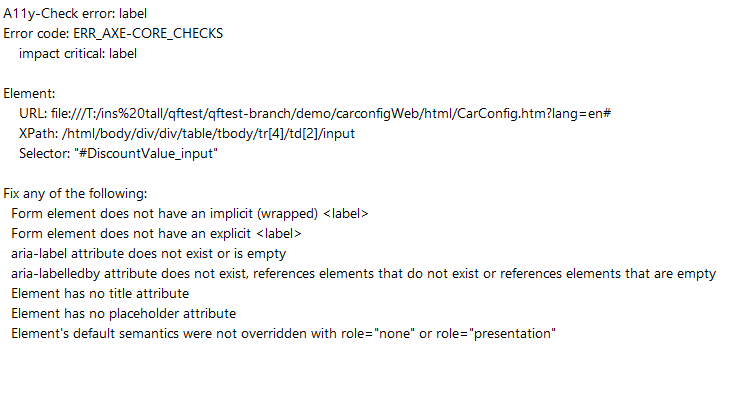
Elements that do not fulfill certain accessibility criteria are listed in error messages. The associated error and additional information, such as suggested solutions, are described in the error message..
Warnings are logged for elements that could not be checked for a specific rule due to various problems, such as being covered by another element.
Depending on the value set for the showSuccessfulChecks parameter, successful checks are also listed as information in the log.
NoteQF-Test In addition to images, QF-Test also logs various identifiers of the elements, such as the X-Path or, if applicable, the SmartID (parameter: logElementSmartIdToMessage). The SmartID can be used to address the element within QF-Test. The X-Path can be used to find the element in the browser using developer tools.
In addition, QF-Test generates a screenshot of the tested page on which faulty and skipped elements are highlighted.
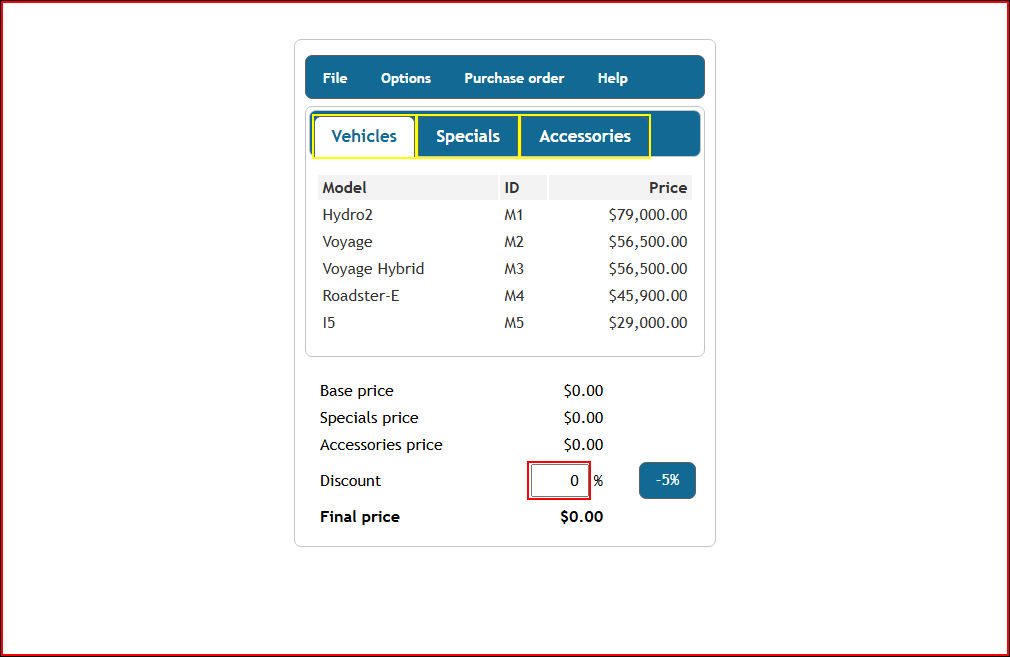
Faulty elements are outlined in red, skipped elements in yellow.
NoteIn order to obtain the most accurate images and highlights of the elements, the screen and browser scaling should be set to 100%.
19.4.2 Notes on generating reports
When creating the report, it makes sense to include the images of the elements generated for the errors in the report. To do this, “Embed thumbnails” must be selected in interactive mode. A fixed value, such as 300x200 pixels, is suitable for scaling the thumbnails.
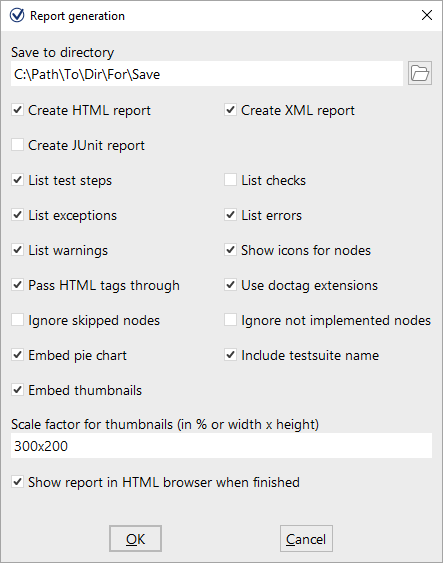
The command line arguments for batch mode are -report-thumbnails and -report-scale-thumbnails <percent>.